How to Track and Report PPC Results Effectively

When it comes to online advertising, Pay-Per-Click campaigns offer businesses a direct path to reach their target audience. However, it’s not just a case of launching a PPC campaign and hoping for the best. A successful campaign requires a combination of insight, analysis and adaptation. For the best results, you need to track and report your PPC results.
When you’ve invested time, effort and money into creating ad copy, choosing relevant keywords and fine-tuning your targeting, you need to know how well your efforts have worked. If you can’t track and report on the outcomes of your PPC campaign, you’re left in the dark. How do you know which aspects are driving results and which hampering your efforts?
Tracking and reporting on PPC results means you can guide the trajectory of your campaign. It means you can refine your efforts and keep your campaign on the path to achieve its aims. From monitoring ad spend and click-through rates (CTRs) to measuring conversions, revenue and return on investment (ROI), you can gain valuable insights into the performance of your campaign.
In this article, we’ll explore the key metrics to monitor and how to leverage the data to make better decisions.
What metrics should you track?
Knowing which metrics to track is fundamental for your campaign’s progress. The metrics you focus on will depend upon the type of campaign you’re running. However, several key metrics should always be on your radar:
- Clicks: This is the number of times users click on your ads. It indicates the level of engagement and how much interest your ad content has generated.
- Impressions: This refers to the number of times your ads have been displayed. It gives you insights into the visibility of your ads and their reach.
- Click-Through-Rate (CTR): This refers to the percentage of impressions that result in clicks. It shows how effective and relevant your ads are to those whom they reach.
- Average Cost Per Click (CPC): This metric is the cost for every click on your ads and it’s useful in helping you to manage your budget allocation. It also means you can assess the cost-effectiveness of your campaign.
- Spend: This refers to how much money you spend on your PPC campaign, which is good for controlling costs and monitoring your budget.
- Conversions: Depending on the goals of your campaign, this shows how many users have completed actions (subscribed to your email list, bought a product, filled in a form, etc.). Ultimately, this metric shows how successful your campaign has been.
For e-commerce campaigns, this is relatively straightforward as you’re tracking sales and transactions. When you set up a lead generation campaign, however, it can be difficult to interpret the quality of your leads by using Google Analytics and Google Ads data. In these cases, it’s often preferable to use a marketing attribution tool like Ruler Analytics. This allows you to see the unique user journey with details so that you can understand the quality of the leads generated by the campaign.
- Conversion Rate: This metric gives you a figure as a percentage of the clicks that have resulted in conversions. It shows how efficient your campaign is in converting traffic into your desired actions like leads or sales.
- Conversion Cost/Cost Per Acquisition (CPA): This is the cost associated with each conversion. It evaluates the ROI of your campaign so you know if the account is cost-effective. This metric is used mainly for reporting on lead generation campaigns.
- Return on Ad Spend (ROAS): This metric relates only to e-commerce campaigns and it measures the profitability of your advertising efforts. It’s calculated as a percentage of the revenue attributable to the ads compared to the cost of the ads.
- Quality Score: This is a rating assigned by platforms like Google Ads. It assesses the relevance and quality of your ads and landing pages. The higher the score (1 to 10), the cheaper the clicks are and the more visibility the ads get.
How should you track and report on these metrics?
To monitor and report on PPC metrics comprehensively, you’ll need a combination of native platform dashboards like Google Ads and Microsoft Advertising and specialised reporting tools. A multifaceted approach like this will give you huge amounts of data to explore.
What A Graph, for example, is an intuitive platform that allows you to create a shareable report—and you can use it without having tech or coding knowledge. Looker Studio is another web-based tool that allows you to explore, analyse and share data insights.
Tools like HubSpot and Ruler Analytics also prove invaluable, particularly for gaining in-depth insights into lead generation performance. HubSpot is known for its comprehensive tracking and analytics, which are tailored to inbound marketing and lead-generation campaigns. Ruler Analytics is similar in that it offers detailed insights into lead generation performance, but its speciality is in providing marketers with actionable data from multiple channels.
How to set up conversion tracking
The process of setting up conversion tracking can vary depending on your unique goals:
E-commerce
The main metrics that you want to track if you have an e-commerce website are transactions and revenue. Other potential conversion actions, such as form completions, aren’t as important for e-commerce businesses.
The difficulty of setting up e-commerce conversion tracking can vary depending on the platform that you are using. E-commerce platforms like Shopify, WooCommerce and Magento are designed to make performance tracking easy. They have a section in their dashboards/back ends where you can simply add your Google Analytics Measurement ID (Admin > Data Streams > select the domain that you want to track > then you should find your Measurement ID) , and they will do the rest; revenue, transactions, and other e-commerce-related stats will start to appear in Google Analytics.

You will need to ensure that you have your Google Analytics links to your Google Ads account, which can be done in the Admin section of Google Analytics under heading ‘Product Links’.
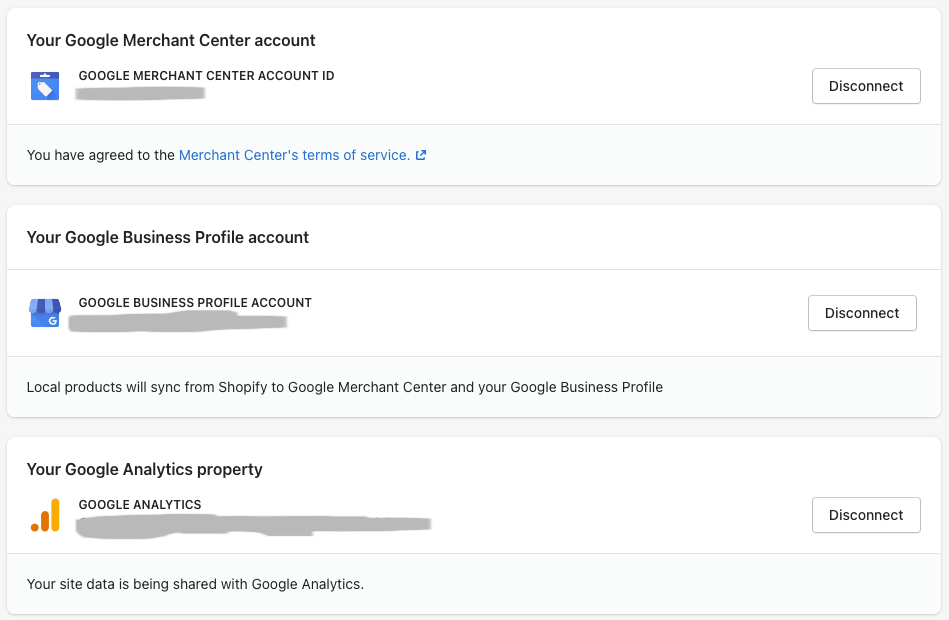
Platforms like Shopify have integrations for Google Analytics, Google Business Profile and Google Merchant Center, which makes it easy to start gathering e-commerce data:

These conversion actions will then need to be imported into your Google Ads account: in your Google Ads account, click Goals > Summary > click the New conversion button > click Import > select Google Analytics 4 properties and then Web > select Purchases.
If your platform doesn’t have an in-built Google Analytics integration, then it can be tricky to track revenue and transactions. Data layers will need to be created so Google Tag Manager can pull data in Google Analytics. Unfortunately, this is quite complex and a developer will be required.
Lead Generation
The main objective for lead generation campaigns is to capture the lead’s details so you or your sales team can contact them or speak to them immediately. The main conversion actions that you should track are form completions and telephone calls. Other conversion actions that you might want to track are newsletter sign-ups, live chat interactions and email address clicks.
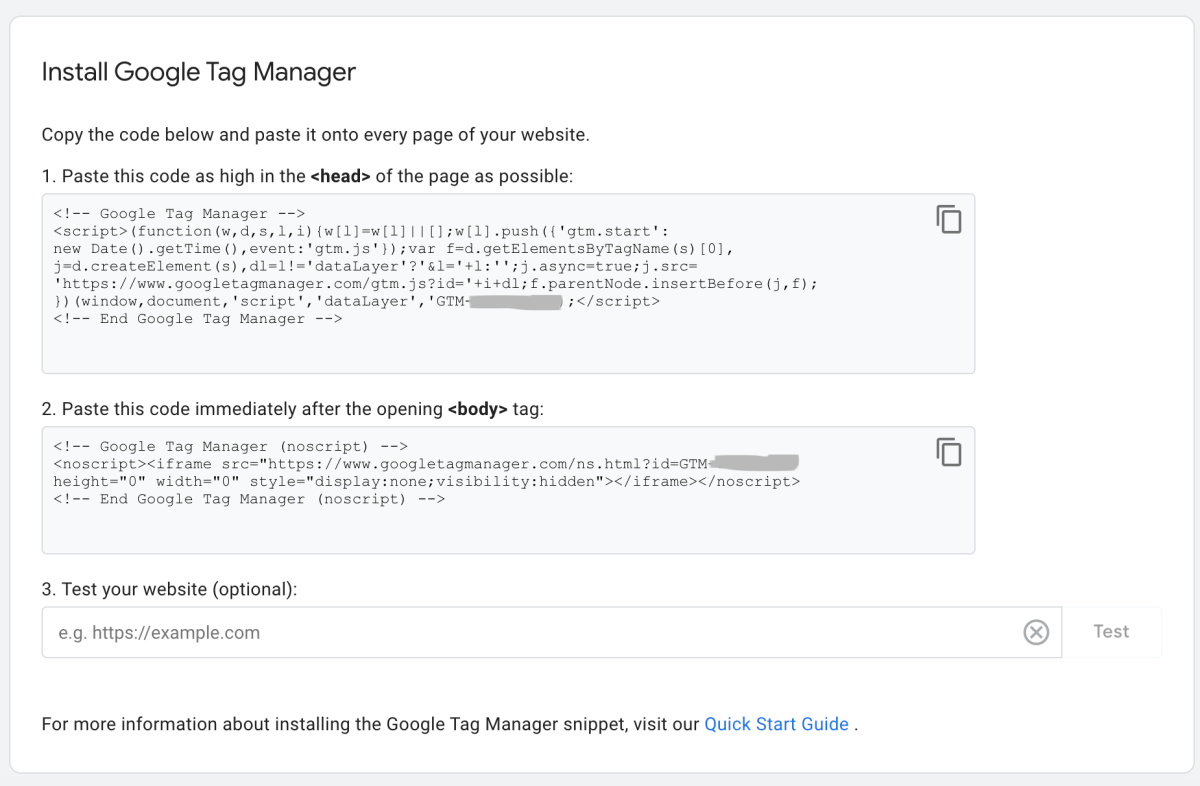
Adding Google Tag Manager to your site should be your first port of call. Create a Google Tag Manager and find the install instructions (Admin > Install Google Tag Manager). If you don’t have experience with coding then you may want to supply the instructions to your developer or find a plugin or app that can assist you.

Add your Google Analytics measurement ID, which will allow you to track metrics such as sessions and visitors.

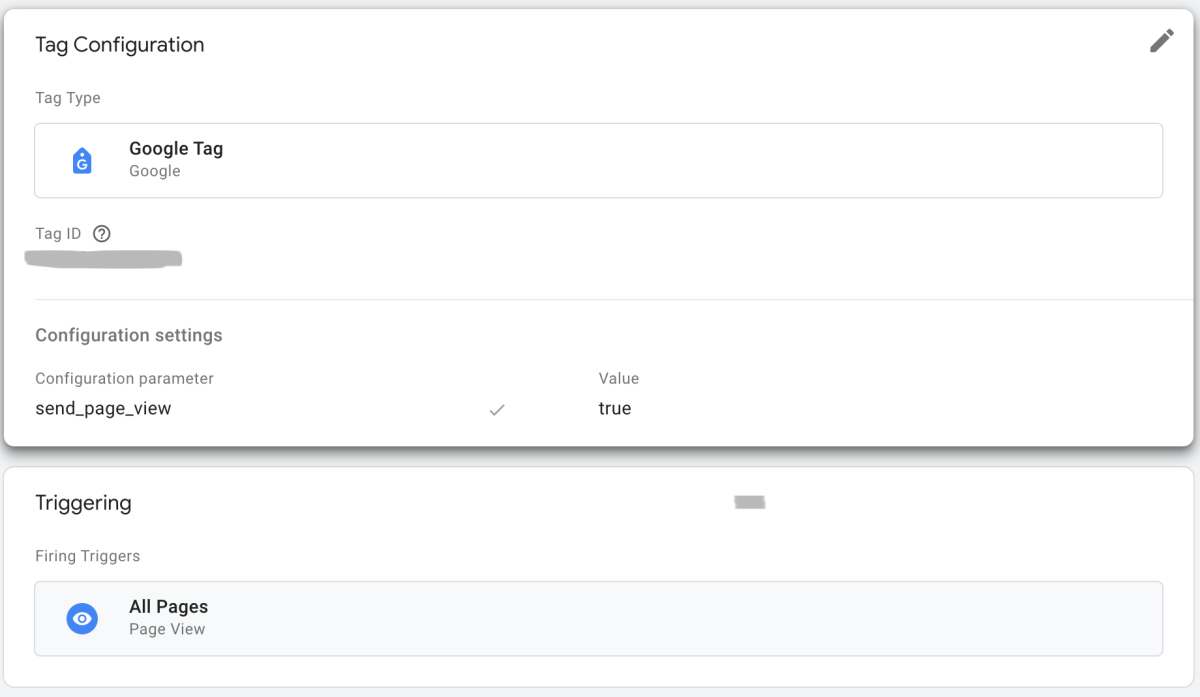
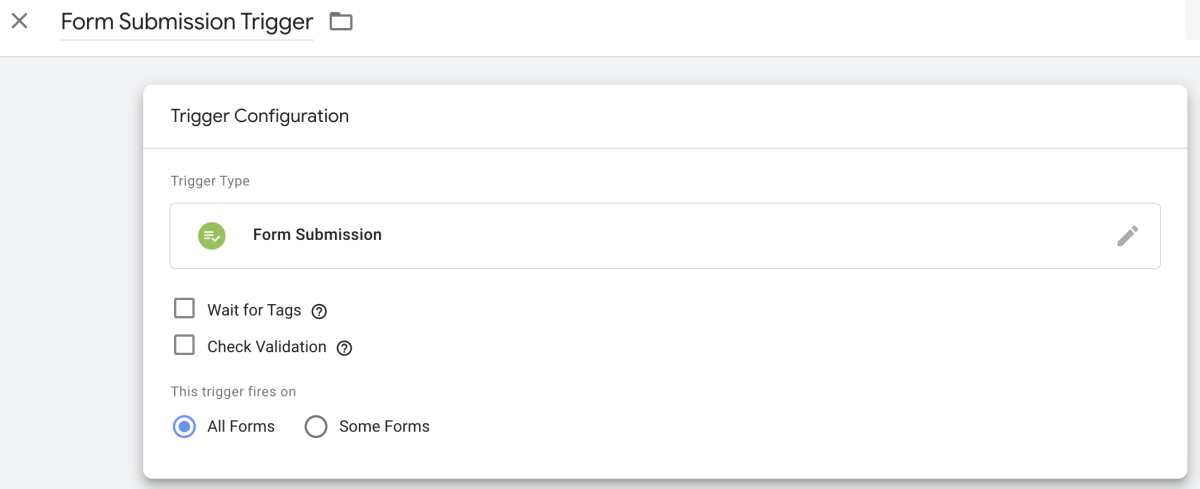
To track form completions, you will need to create a tag and a trigger that will identify when a form completion has taken place. Google Tag Manager has the option to create a trigger that will fire whenever a form is completed.

Tracking phone calls can be a bit trickier. You can create a tag and a trigger in Google Tag Manager that will fire when a visitor clicks on a telephone number. To gain more insight into who is calling, a marketing attribution tool like Ruler Analytics is required.
Once you have created your tags in Google Tag Manager, you will need to test them to ensure they are firing correctly. The actions will appear in Google Analytics as events in around 24 hours they are working correctly. The events will then need marketing as Key Events (Admin > Events > Toggle the button under the Mark as key event column) then they should be imported into Google Ads.


Outro
Mastering PPC tracking and reporting means you can stay ahead of the competition. By using native platform dashboards and other reporting tools, you can reveal a plethora of valuable insights into how your PPC campaign is performing. The key to success, however, also stems from how you use the data to optimise your campaigns. Whether your focus is lead generation or e-commerce, good conversion tracking is only as useful as the actions you take when you analyse its success.
